
Affinity Diagrams
Ghassan Saleh, DMD, DS
Director, MaineHealth Performance Improvement
Learning Objectives:
- Define the affinity diagram and clarify when best to use.
- Illustrate the steps in generating affinity diagrams.
- Describe best practices when developing affinity diagrams.
Let’s imagine that you are in a grocery store. You are taking care of your weekly shopping and trying to go through your list. You start by grabbing some oranges in the fruit and vegetable department, a gallon of Greek yogurt from the dairy department and some Cheetos from the chip aisle. As you go further down the list you realize that you also need some peaches – back to the fruit and vegetable area. And guess what? You also need some milk and cheese. You cross the store again to dairy section. Before you know it, you go back and forth several times. Wouldn’t it be a lot easier and more effective if you had grouped everything you needed by categories? That’s the idea of the affinity diagram.
An affinity diagram is a visual tool that helps improvement specialists organize the information they come up with during a brainstorming session. This organization take place by grouping those ideas to their affinity, or similarity. This way, the generated ideas become easier to act upon. The affinity diagram can also help stimulate new patterns of thinking, sparked by groups formed to find creative solutions to difficult problems and involving people from diverse backgrounds.
When to Use the Affinity Diagram?
Simply put, when your brainstorming session is over. Affinity Diagrams aren’t a brainstorming tool themselves but rather a way to organize, consolidate and act on ideas. They are specifically helpful when:
- Brainstorming with a large group of people
- You end up with a big number of ideas (or lot of data points)
- Dealing with complex problems
- Group consensus is needed
Tips: Good Practice when Developing Affinity Diagrams:
- Always start your brainstorming session with a clear objective – What is the problem at hand? What are you trying to solve?
- Assign a facilitator to help keep the conversation focused.
- Don’t come up with predetermined categories for your affinity diagram. You decide on the categories after all ideas are out on the white board (or virtual board).
- Lastly, affinity diagrams helps you solve for the three killers of a Kaizen meeting: 1) Meet, not discuss. 2) Discuss, not decide and 3) Decide, not do. Affinity diagrams can certainly help you decide but you should always follow that decision with a clear action plan: who is going to do what, when and how to make sure that the “do” is happening.
Steps Taken in Generating Affinity Diagrams
There are four steps in developing affinity diagrams. They are:
Step 1: Display ideas you generated during a brainstorming session.
MaineHealth OpEx program’s preferred way of brainstorming is “brain-writing” where each idea is written down on one sticky note (or virtual sticky). Figure #1 is an example of displayed ideas for issues in implementing Continuous Process Improvement in healthcare
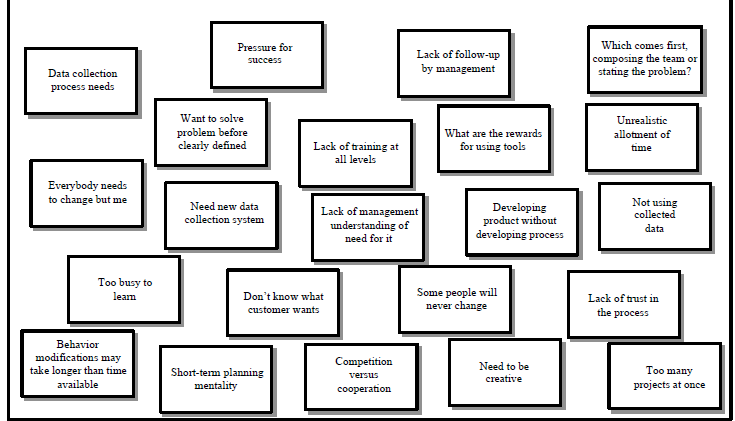
Figure 1: Issues in Implementing Continuous Process Improvement in Healthcare
Step 2: Sort ideas into similar groups.
Figure #2 shows the same ideas as figure #1 organized into similar themes.
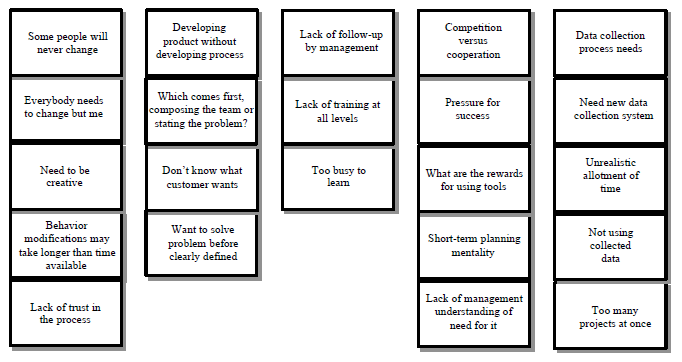
Figure 2: Issues Organized into Similar Groups
Step 3: Create header cards.
Header cards are created for each of the groups choosing a title that best describe the theme of each group. See Figure #3
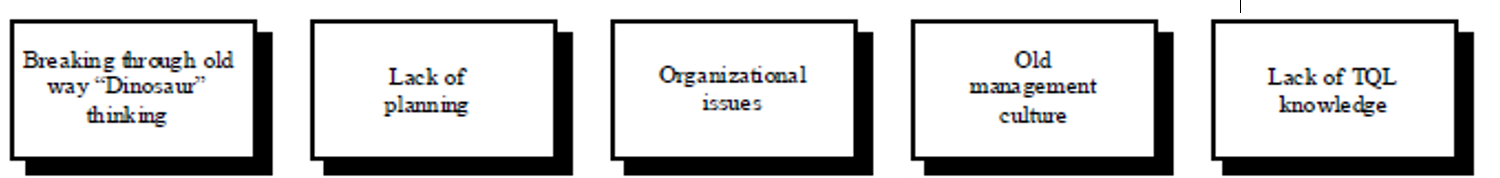
Figure 3: Header Cards for Each Group of Ideas Categorized in Step #2.
*TQL in the far right box = Total Quality Logistics.
Step 4: Draw finished diagram.
The finished diagram displays each group of ideas with their respective header card at the top of the group. Figure #4 shows the final product of the affinity diagram for issues in implementing continuous improvement in healthcare.
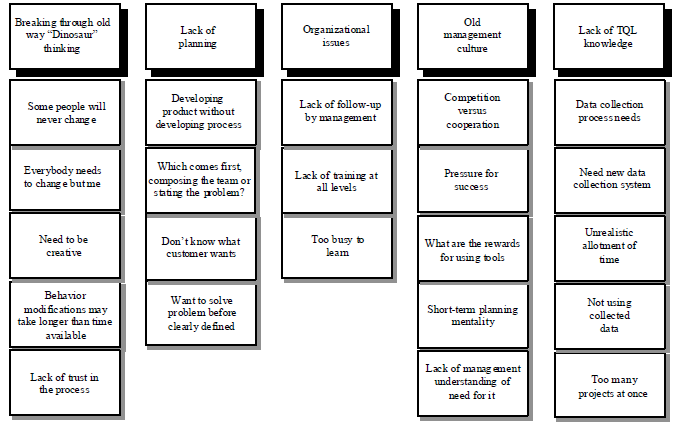
Figure 4: Finished Diagram
Resources:
- 6th edition of the Project Management Body of Knowledge (PMBOK Guide).
- Minnesota Department of Health https://www.health.state.mn.us/communities/practice/resources/phqitoolbox/affinitydiagram.html
- Pictures of the example is adopted from 2013 American College of Cardiology, CQI Knowledge Assessment Quiz: Answer Key https://cvquality.acc.org/docs/default-source/qi-toolkit/03_knowledgeassessmentquiz_answerkey_12-10-13new.pdf?sfvrsn=55478fbf_2
Want to earn CE credits? Click here
Download PDF